0
Currency & Commodity Analysis:
US Dollar Index
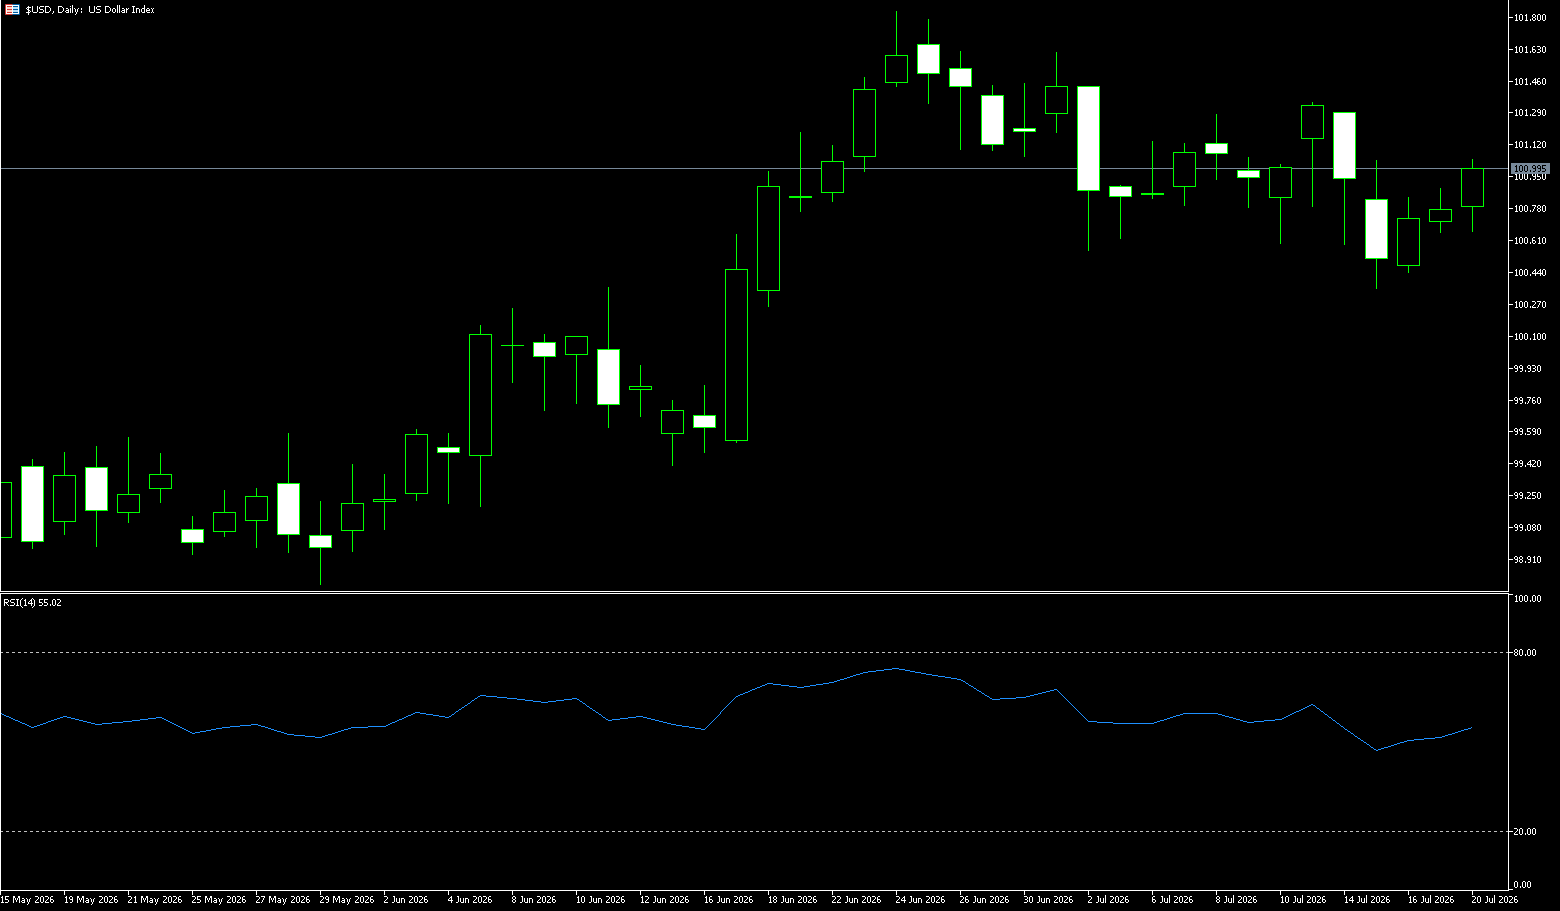
The US dollar index traded near 100.90 on Monday, supported by escalating tensions in the Middle East, which boosted oil prices and exacerbated concerns about inflation and the prospect of higher interest rates. The US military said it conducted new airstrikes against Iran on Sunday after three US service members were killed, while Tehran declared that the ceasefire with the US had effectively collapsed and said it intercepted four ships passing through the Strait of Hormuz over the weekend. Meanwhile, Cleveland Federal Reserve President Beth Hammark joined a growing number of Fed officials on Friday in warning of persistent inflation. The market currently estimates a 53% probability of a Federal Reserve rate hike in September, up from 47% the previous day, although the general expectation is that the central bank will keep rates unchanged at its meeting this month. The dollar index was essentially flat on Friday, closing at 100.76, supported by safe-haven demand triggered by renewed escalation of US-Iran tensions, but traders reduced their bets on a near-term Fed rate hike due to moderate US inflation data.
From a technical perspective, the dollar index is currently trading at 100.90, closely below the 9-day moving average of 100.91. The MACD histogram shows a moderate increase in bearish momentum, indicating weak short-term momentum, but limited downside potential. Technically, the index has been declining from its previous high of 101.80, reaching a low of 95.36 before gradually stabilizing and rebounding, and is currently in a consolidation phase. Market assessments of the US economic fundamentals are also mixed. Regarding inflation, June data showed some easing, enough to raise the probability of the Fed keeping rates unchanged at its July meeting to 86%. The market's pricing in further interest rate hikes may still be too high; at least for now, the US dollar may have peaked around several weeks ago. If this assessment is confirmed by subsequent data, the US dollar index may end its correction near the 100 level and return to a weaker structure. Downside targets will be 100.36 (last week's low) - 100.00 (psychological support level), with the index heading towards 99.49 (June 17th low). Upside targets are the 101 psychological level, and 101.35–101.60 (the high of this rebound, a key level for bulls and bears) are the next target prices for the bulls.
Today, consider shorting the US dollar index at 101.06, with a stop loss at 101.18 and targets at 100.60 and 100.50.
WTI Crude Oil
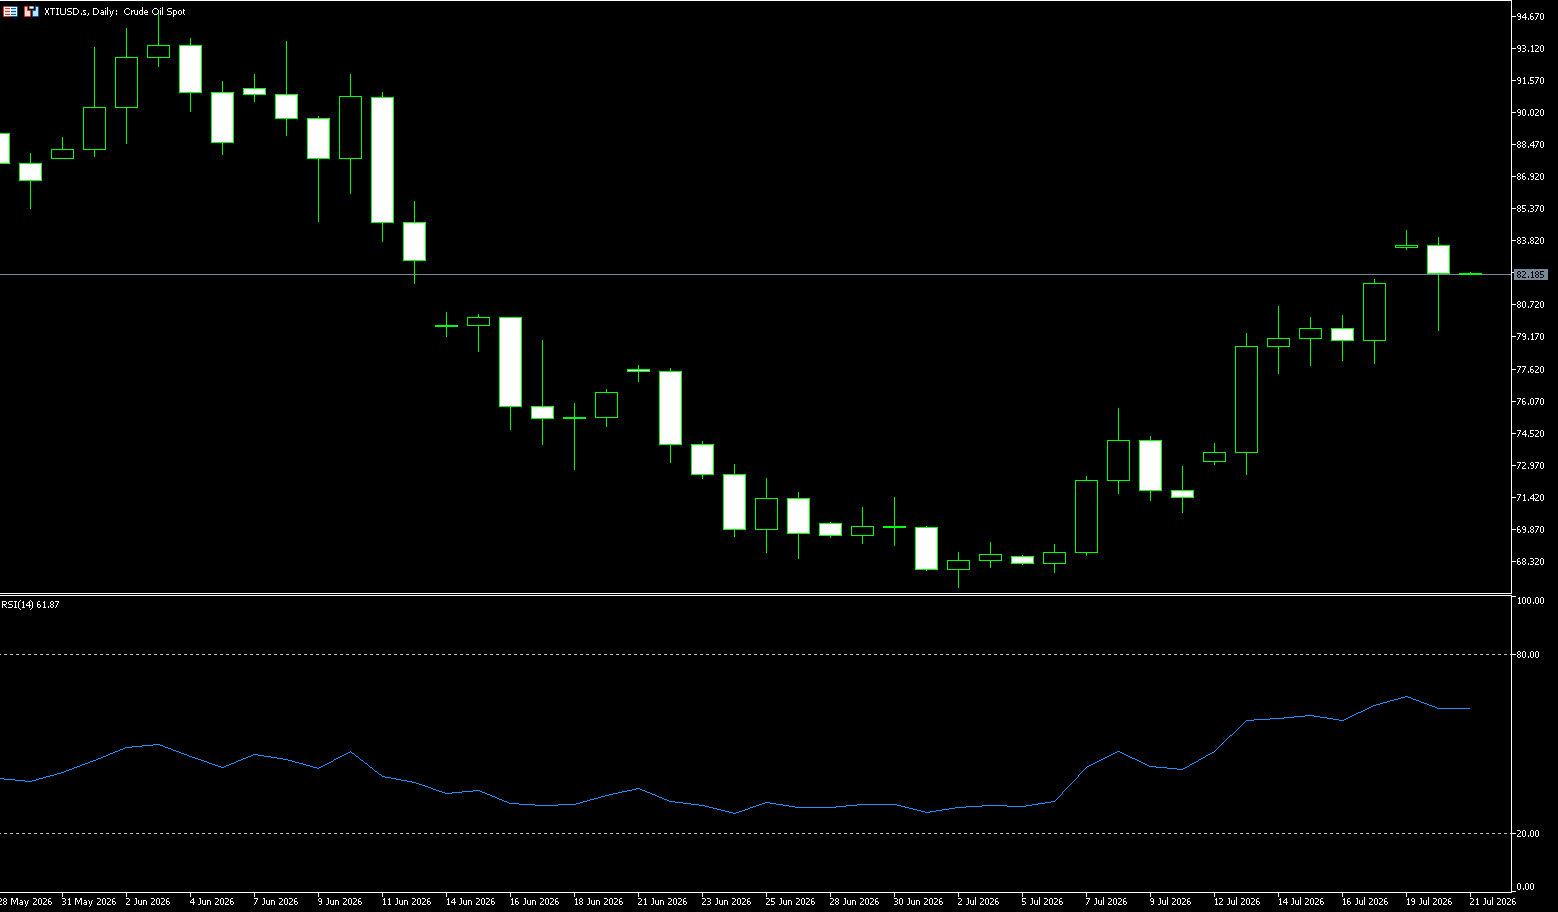
On Monday morning in Asian trading, US crude oil gapped up more than 3%, briefly touching a one-month high above $84.00 per barrel. Tensions between the US and Iran continued over the weekend, with the US issuing a global security alert, increasing geopolitical uncertainty. The Israeli military stated it was prepared to resume combat operations against Iran at any time. Israel Defense Forces Chief of Staff Zamir publicly stated on July 19 that the Israeli military was closely monitoring Iranian missile launches and was ready to resume combat operations against Iran at any time. This statement stemmed directly from the detection of Iranian missile launches towards Jordan's Aqaba region that day. The Israeli military immediately launched multiple anti-aircraft interceptors. Although missile debris ultimately landed near Eilat, the Israeli air defense system was on "high alert." Last week, the oil market experienced a dramatic repricing triggered by a geopolitical powder keg. WTI crude oil surged approximately 15% on the week, with the pricing logic shifting abruptly from inventory and demand expectations to a risk premium model based on supply disruptions.
This week's surge in oil prices is essentially a concentrated release of geopolitical risk premiums. In the oversold area around $70, short covering and speculative long positions combined to push prices near the upper Bollinger Band resistance level. In the short term, the intensity of the US-Iran conflict remains the sole core variable influencing oil prices. US crude oil prices move highly in tandem with Brent crude, previously rising to $113.28 before falling to $67.048, and then rebounding strongly to around $84 at the beginning of this week. Technically, the current price is between the Bollinger Bands high of $82.90 and the 100-day moving average of $87.80, with about $2 of room before reaching the psychological level of $90.00. The MACD histogram continues to expand, and the DIFF line has crossed above the DEA, indicating a clear golden cross signal and a good continuation of the rebound trend. Upside targets are the 100-day moving average at $87.80 and the psychological level of $90.00. Downside targets are the 45-day moving average at $81.26 and the $80.00 area (a psychological level).
Today, consider going long on crude oil at $82.15, with a stop loss at $82.00 and targets at $85.00 and $84.00.
Spot Gold
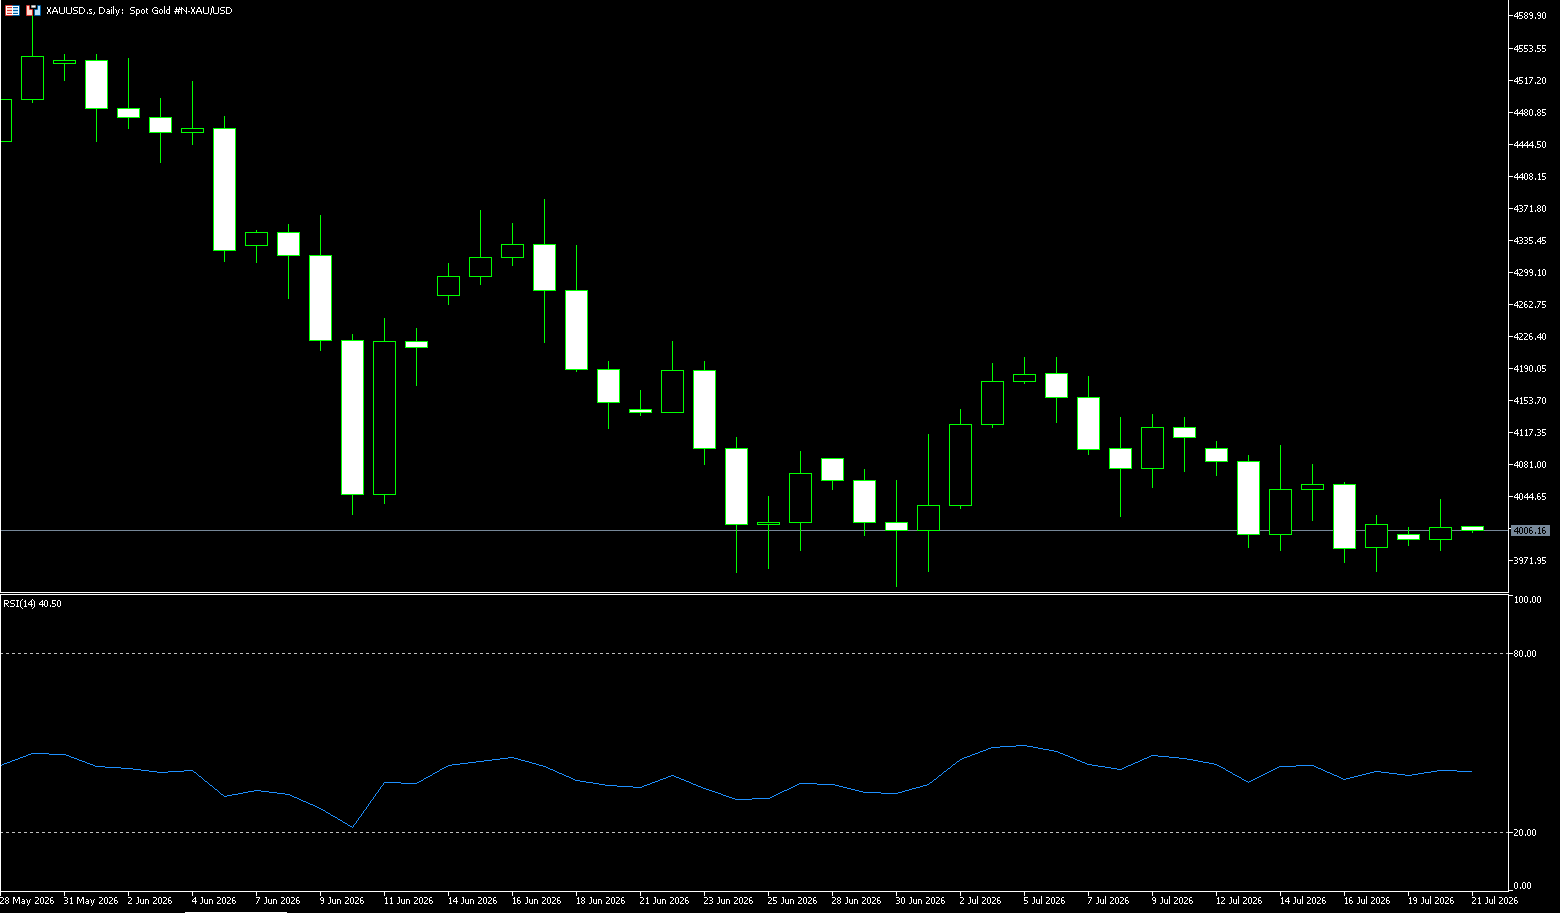
Spot gold weakened slightly on Monday, briefly falling below the $4,000 level to $3,982. Currently trading around $4.010 per ounce, gold prices are pressured by the escalating US-Iran conflict, which has pushed oil prices up by over 3%, exacerbating inflation concerns and strengthening the dollar. Last week, gold recorded its biggest drop in six weeks, falling 2.5% cumulatively. Despite resilient economic data and rising expectations of a Fed rate hike, gold is technically severely oversold, with the $4,000 support level being repeatedly tested. Market opinions are divided, with short-term pressure prevailing, though a summer rebound catalyst may emerge. Geopolitical risks and policy maneuvering continue to create uncertainty for gold's future. The US Energy Secretary stated that US military action against Iran will continue, and the State Department issued a global security alert, increasing geopolitical uncertainty, exacerbating inflation concerns, boosting rate hike expectations, and limiting gold price gains. A stronger dollar and heightened global inflation concerns are the main drivers of the gold sell-off, pushing up global interest rates.
For investors, the $4,000 level has become a key psychological and technical level. Short-term volatility may continue, but from a medium- to long-term perspective, gold's intrinsic value as a hedge against inflation and uncertainty remains intact. Historical experience shows that in oversold conditions, any positive catalyst—whether a policy shift or an evolution of geopolitical events—can ignite a retaliatory rebound. After gold prices broke below a key level last week, short-term bears have maintained a technical advantage, with prices remaining below the psychological level of $4,000. The primary upside target for the bulls is to recover the $4,000 level, and if it holds, look towards $4,050 (the 9-day moving average), with a further target of $4,100 (the psychological level). The short-term downside target for the bears is a break below the $3,982 (Monday's low) support, with deeper targets at $3,943.70 (the June 30th low), and potentially further testing $3,820 (last October's low) and the $3,800 (psychological support level).
Today, consider going long on gold at 4,005, with a stop-loss at 4,000; targets: 4,060; 4,050.
AUD/USD
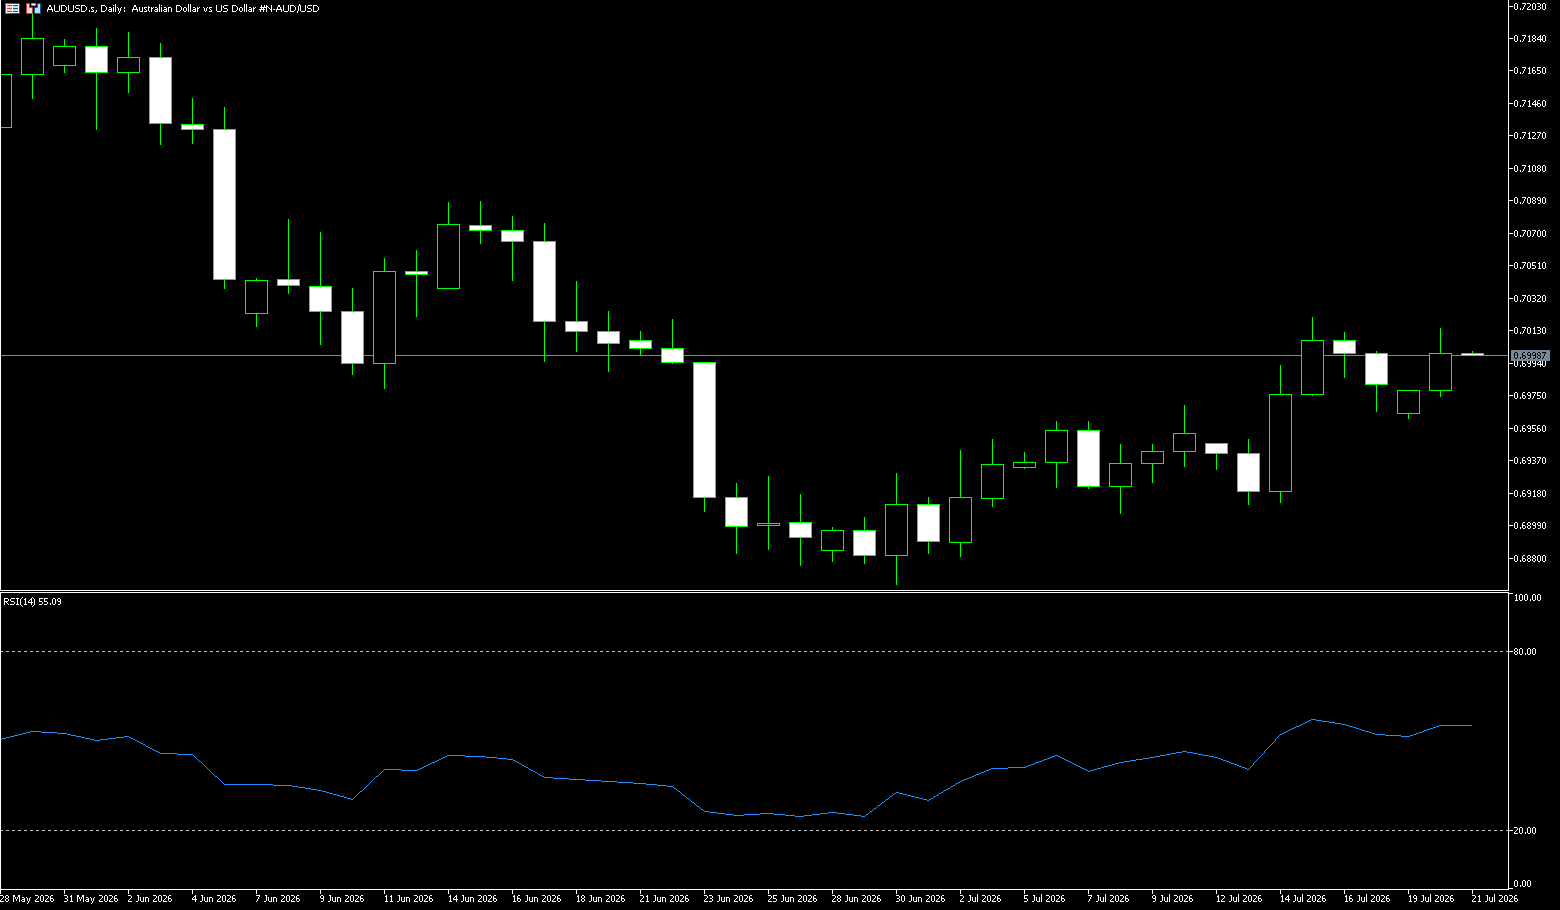
During Monday's Asian trading session, the Australian dollar rose 0.12% against the US dollar, approaching 0.6995. The Australian dollar rebounded after a lower open as markets anticipated the Federal Reserve would not raise interest rates at its policy meeting later this month, putting selling pressure on the US dollar. The US dollar index, which measures the dollar against six major currencies, edged lower, trading around 100.70. The dollar index fell sharply after a strong open. According to the CME FedWatch tool, the probability of the Fed keeping interest rates unchanged at its July meeting is 85.6%, up from 65.8% recorded last week. Following the release of the US June Consumer Price Index (CPI) data, market participants were convinced the Fed would maintain the status quo at its July meeting, which indicated easing inflationary pressures.
On the daily chart, the Australian dollar is trading at 0.6995 against the US dollar, maintaining a slightly bearish short-term bias as it continues to trade below the 50-day and 100-day simple moving averages clustered between 0.7043 and 0.7059, while the 200-day simple moving average at 0.6889 provides deeper trend support. Momentum has improved somewhat, with the Relative Strength Index (RSI) at 52.5, moving into positive territory rather than a complete reversal. On the upside, initial resistance lies at the 50-day and 100-day simple moving averages between 0.7043 and 0.7059, forming a dense upper shadow; a break above this area is needed for bulls to open a path to the 0.7100 level. Immediate support is seen near the 0.6941 level (21-day simple moving average) and the 0.6889 level (200-200-day simple moving average), where strong support is expected.
Consider going long on the Australian dollar at 0.6985 today, with a stop loss at 0.6975 and targets at 0.7030 and 0.7040.
GBP/USD
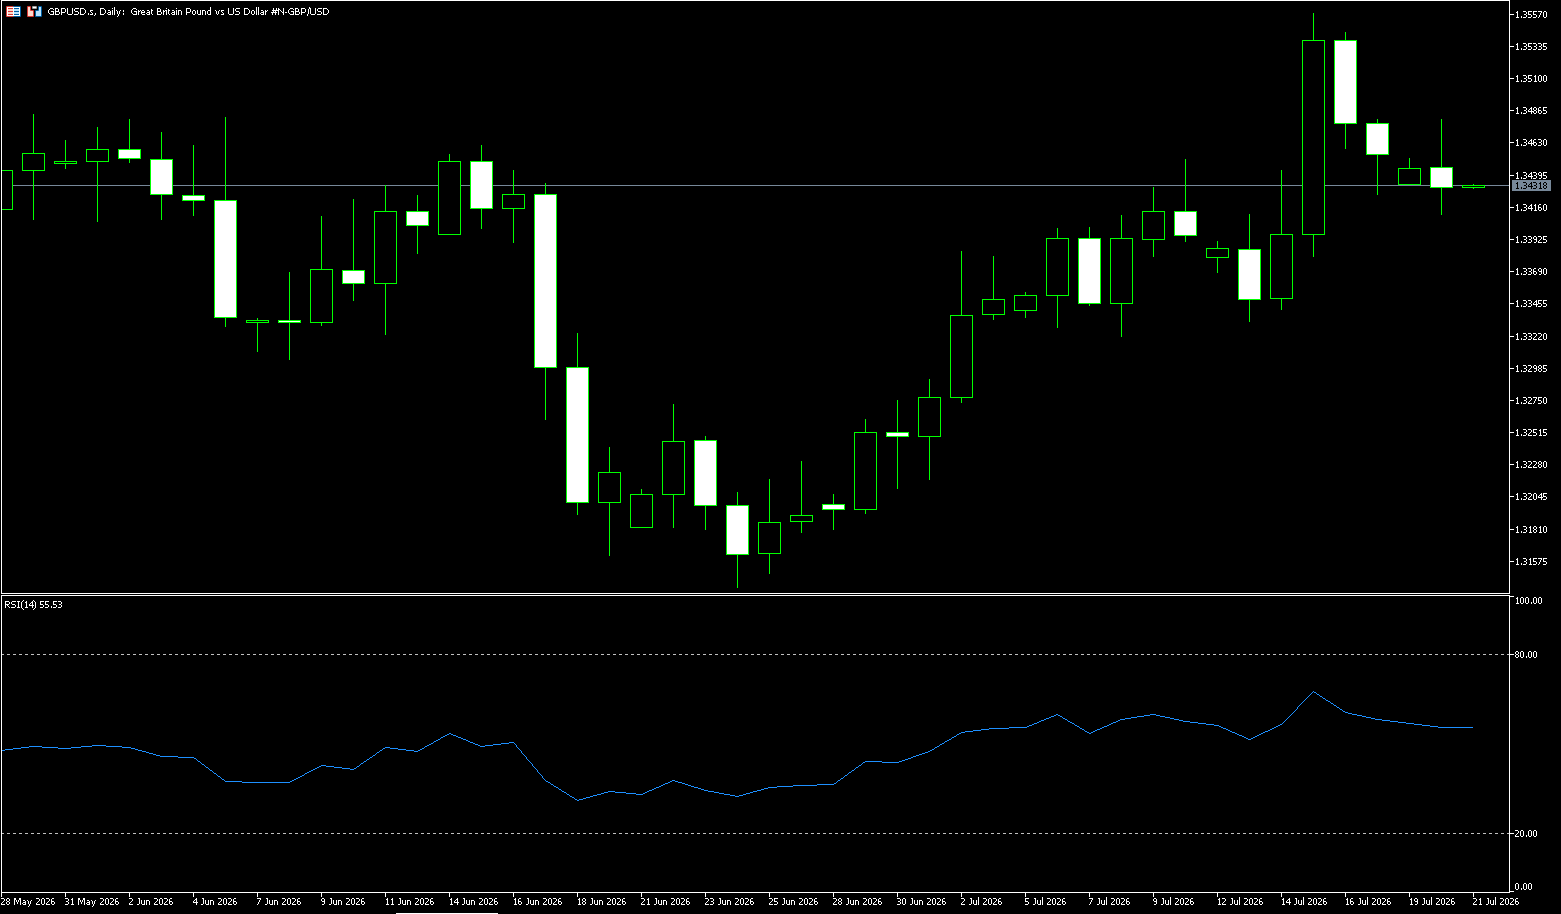
The GBP/USD pair was flat around 1.3430 during Monday's Asian morning session. Traders continued to assess developments surrounding US-Iran tensions after the US reported the death of a third US soldier in the past two days. The UK jobs report will be in focus later on Tuesday. The US reported another US service member killed in a controlled detonation of a crashed Iranian drone in northern Iraq. The week-long back-and-forth strikes have expanded from purely military targets to bridges, utilities, and port facilities, raising concerns about a protracted conflict in the Middle East. This, in turn, could weigh on riskier assets like the pound against the dollar in the short term. However, signs of softening US consumer and producer inflation have weakened market bets on a Fed rate hike, which could limit the dollar's upside.
GBP/USD is trading at 1.3430. The currency pair broke through the downside resistance line from the May high but remains capped below the Bollinger Band at 1.3549. Momentum indicators on the daily chart are neutral to bullish, with the Relative Strength Index (RSI) hovering above 55 and the Moving Average Convergence Divergence (MACD) in positive territory. However, the aforementioned Bollinger Band at 1.3549 may prove difficult to break. A break above this level would target the psychological high of 1.3600. On the downside, the bottom of the trading range over the past two weeks at 1.3400 could pose a challenge for bears. Further down, the broken 20-day simple moving average, now at 1.3334, and the 1.3300 level will be the next targets.
Consider going long on GBP/USD at 1.3415 today, with a stop loss at 1.3406 and targets at 1.3480 and 1.3470.
USD/JPY
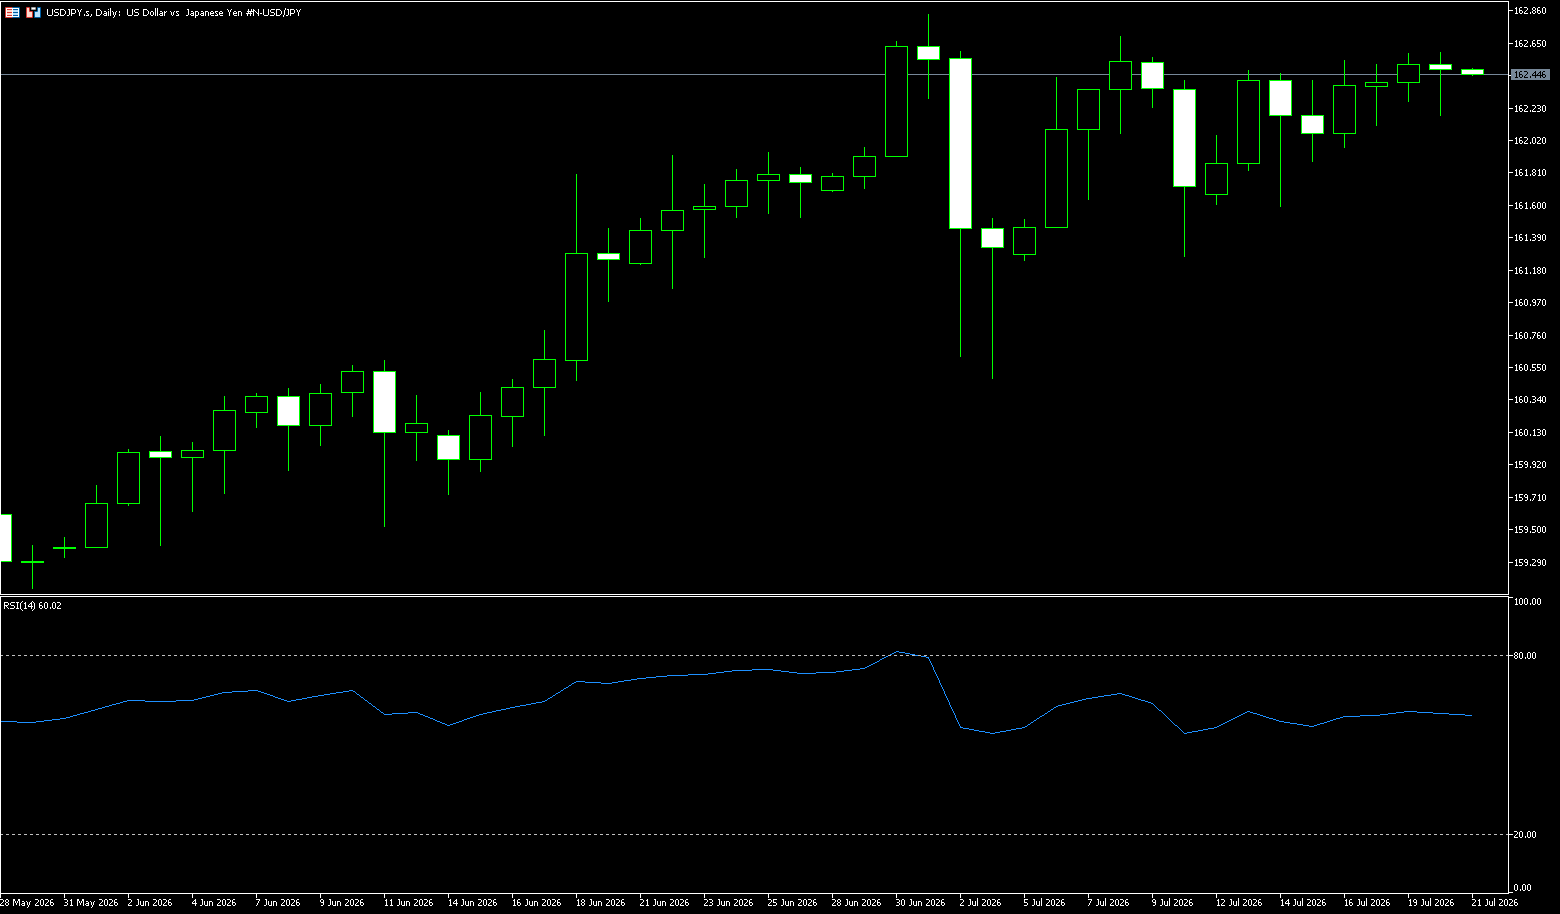
The yen traded around 162.45 per dollar on Monday, hovering near its weakest level since 1996, pressured by a stronger dollar and soaring oil prices due to escalating conflict in the Middle East. The US military launched new airstrikes against Iran after the deaths of three US service members, while Tehran said the ceasefire with the US had effectively collapsed and claimed to have intercepted four ships transiting the Strait of Hormuz over the weekend. Japan's heavy reliance on Middle Eastern oil imports makes the yen particularly vulnerable to supply disruptions and rising energy costs. Investors have also seen little sign of decisive action from Tokyo to support the currency, awaiting intervention data later this month for clues as to whether Japanese authorities were involved in the yen's sharp but short-lived rally in recent weeks.
For the yen to achieve a sustainable recovery, the Bank of Japan needs to signal a more hawkish stance, while the government needs to provide reassuring statements on fiscal policy. With interest rate differentials not yet shifting in favor of the yen, the yen's weakness is unlikely to reverse fundamentally in the short term. Daily technical analysis shows that the USD/JPY exchange rate continues to fluctuate above the 162 level, suggesting that the bulls still have the upper hand. The 14-day Relative Strength Index (RSI) is around 59, remaining in positive territory and not yet showing overbought signals, suggesting continued but moderate upward pressure. Initial resistance for USD/JPY is at the 40-year high of 162.84 reached on July 1st. Further upside, the 127.2% Fibonacci retracement level of the early July pullback at 163.50 is a reasonable target. On the downside, the next target below the recent support is the 161.30 area, where the July 10th low is located, and the bearish target of the triangle pattern at 160.49 (the July 3rd low).
Today, consider shorting the US dollar at 162.70, with a stop-loss at 162.85 and targets at 161.70 and 161.80.
EUR/USD
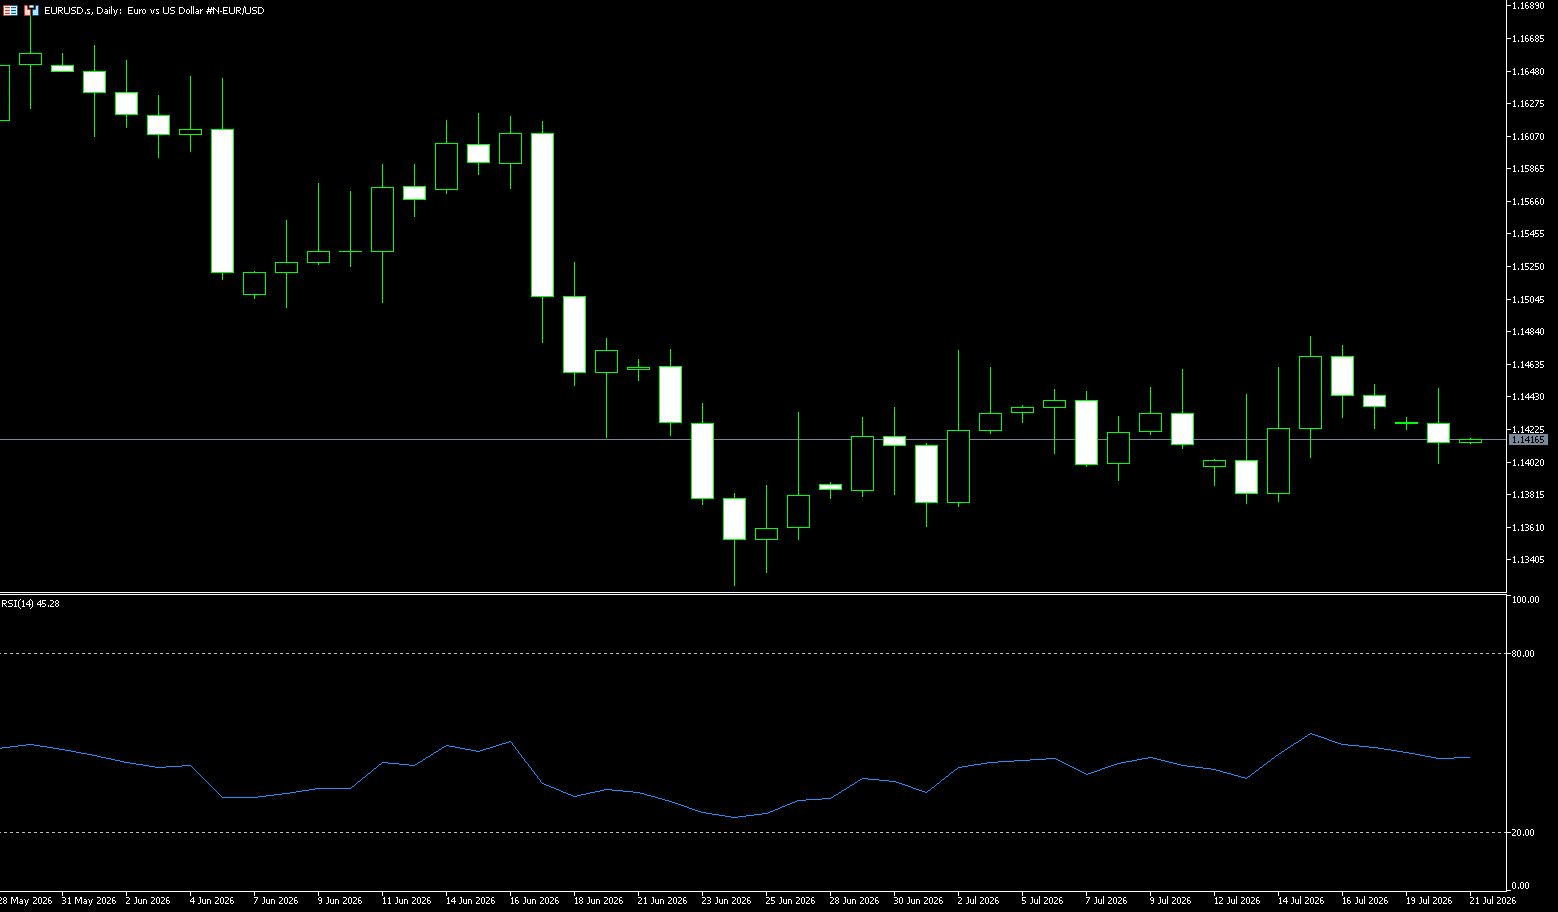
During Monday's early European session, the EUR/USD pair traded in positive territory around 1.1420, supported by the European Central Bank's hawkish tone. According to Reuters, the ECB is expected to keep interest rates unchanged on Thursday, but is also expected to raise rates for the second time this year in September due to the risk of stronger inflationary pressures exacerbated by a renewed surge in energy prices. However, escalating tensions in the Middle East could drive safe-haven inflows, supporting a stronger dollar relative to the euro. Bloomberg reported that the US has launched its ninth night of strikes against Iran, with Washington stating that Sunday's airstrikes were intended to "punish" Iran after the first US military deaths since the resumption of hostilities with the Islamic Republic. Iran's Islamic Revolutionary Guard Corps (IRGC) stated that the Strait of Hormuz will not be safe for petrochemical products or "single drop" oil and gas shipments as long as US operations in the region continue.
On the daily chart, EUR/USD is currently at 1.1420, maintaining a bearish short-term tone as it remains below the 55-day simple moving average at 1.1543. The price is near the Bollinger Band at 1.1470, suggesting the latest rally is encountering resistance, while the Bollinger Band middle line at 1.1414 and the 1.1400 (psychological level) area provide dynamic support nearby. The 14-day Relative Strength Index (RSI) is around 48, still below the neutral 50, indicating only moderate upward momentum and reinforcing the view that the pair's rallies are limited as it trades below longer-term moving averages. On the upside, immediate resistance lies at the Bollinger Band at 1.1470, with stronger resistance at the 55-day simple moving average at 1.1543, where selling interest could resurface if tested. On the downside, the Bollinger Band middle line at 1.1414 and the 1.1400 (psychological level) area provide dynamic support nearby. Next is the lower Bollinger Band around 1.1358; a clear break below this band would open up room for a wider downward continuation.
Today, consider going long on the Euro at 1.1400, with a stop loss at 1.1390 and targets at 1.1450 and 1.1460.
Stock Analysis:
Australian ASX 200 Stock Index
Basic Market Overview:
The Australian Securities Exchange (ASX) 200 index closed nearly flat on Monday at 8791 points, pausing after two consecutive days of weakness. Energy and mining, consumer services, and non-durable goods rose, but declines in technology, healthcare, and non-energy mining companies offset these gains. Investors remained cautious as they awaited Australia's June labor market data and the preliminary July purchasing managers' index later this week. Meanwhile, geopolitical tensions escalated as the conflict between the US and Iran widened, with attacks on Iranian civilian infrastructure. In China, a major trading partner, the central bank kept its key lending rate unchanged for the 14th consecutive month in July pricing, in line with expectations, as policymakers seek a balance between supporting growth and maintaining monetary stability.
Energy stocks rose, with Woodside Energy and St. Toth Energy gaining 1.5% and 1.7% respectively. Meanwhile, South 32 rose 4.2%, and Amber Limited gained 1.3%. On the downside, gold stocks declined, dragged down by Evolution Mining (-1.8%) and Northern Star Resources (-0.9%). Among bank stocks, two of the four major banks fell between 0.2% and 0.5%.
Sector Performance:
The market closed down approximately 0.1% to 0.3% for the week, marking its second consecutive week of weakness. Defensive and oil & gas sectors performed strongly across the board, while resource mining and technology sectors significantly dragged down the index.
Top Performing Sectors This Week (from strongest to weakest)
Top Performing Sectors (from strongest to weakest)
1. Energy +1.80% (strongest performer)
Driven by: Escalating US-Iran conflict and concerns about shipping in the Strait of Hormuz pushed Brent crude oil above $90, with crude oil rising nearly 9% for the week.
Key Stocks:
◦ Deep Yellow (uranium mining) +6.10%, Yancoal Australia +5.97%
◦ Karoon Energy +4%, Santos +1.7%, Woodside +1.5%, Ampol +1.3%
2. Consumer Staples +0.43% The food and supermarket sector rose for the second consecutive day; Endeavour, a liquor company, was downgraded by an institution, dragging down the sector's upper limit.
3. Telecommunications +0.39% A slight increase for the third consecutive day, with defensive funds slightly allocating to safer investments.
Leading Sectors (from largest to smallest decline):
1. Information Technology (IT) -1.55% (weakest sector)
Driven by: A sharp drop in US Nasdaq AI growth stocks last Friday, putting pressure on high-valuation tech stocks for profit-taking.
Key Stocks: WiseTech Global -2.6%, Xero -2.1%, Megaport -1.1%
2. Utilities -0.63%
3. Healthcare -0.49%
4. Materials -0.3% Significant internal divergence: South32, a coal/integrated mining company, surged, but gold and copper mines weakened; Evolution Gold -1.8%, Northern Star Gold -0.9%, Rio Tinto -1.4%.
5. Consumer discretionary and industrial real estate sectors weakened slightly (-0.1%~-0.2%)
Technical Analysis:
The ASX200 closed at 8791 on Monday, down slightly by 0.06% intraday. Futures opened 0.6% higher in the morning but then retreated, trading within a narrow range throughout the day, indicating a balanced market with both bulls and bears observing. The daily chart shows range-bound trading, with Monday's ASX200 closing with a neutral doji, indicating a short-term consolidation within a narrow range of 8760-8815, with no clear direction. Short-term trading should prioritize buying low and selling high within this range; a close above 8815 would signal a bullish trend; a break below 8760 would suggest a pullback. With a dense schedule of macroeconomic data releases this week, maintain a light position and strict stop-loss orders throughout. The candlestick pattern: a doji close, indicating a pullback after a rise, with balanced upper and lower shadows, suggesting strong market caution. Technical indicators show RSI (14): around 52, neutral range, no overbought or oversold conditions, balanced bullish and bearish forces; MACD: fast line crosses below slow line to form a weak death cross, green bars expand slightly, short-term pressure is expected, but no deep short-selling signal is seen; ADX: 29, weak trend strength, typical characteristics of a sideways market, low probability of a one-sided trend;
Trading Strategy:
The following are only technical trading ideas and do not constitute investment advice. Leveraged trading may result in losses exceeding the principal.
Long Entry
Enter when price retraces to the 8760–8770 range and stabilizes with a positive close.
Stop Loss: Effective break below 8750 (30-point risk control)
First Take Profit: 8805–8810; Second Take Profit: 8840
Short Entry
Enter when price rebounds to 8810–8815 and encounters resistance and stagnation.
Stop Loss: Above 8820 (30-point risk control) (Risk Control)
First Take-Profit: 8770; Second Take-Profit: 8760
Key Risk Warnings:
1. Escalating tensions in the Middle East: Soaring oil prices benefit energy, but a global sell-off in risk assets drags down the overall market;
2. Stronger-than-expected Australian employment data: Market expectations for interest rate hikes rise, putting pressure on banks and growth stocks, with the index testing 8760;
3. No Chinese policies to stabilize growth implemented: Weakness in the mining resources sector suppresses the ASX200 weighting;
4. Continued correction in US tech stocks: This impacts the Australian tech sector, dragging down the index's rebound.
China Shanghai Composite Stock Index
Basic Market Performance:
On Monday, the Shanghai Composite Index rose 0.85% to close at 3,796.3 points, while the Shenzhen Component Index fell 0.71% to 13,610.2 points, showing mixed performance despite increased efforts by authorities to stabilize the country's weak stock market. China State-owned Assets Supervision and Administration Commission (SASAC) and China Chengtong Holdings Group announced they have increased their holdings of Chinese stocks and pledged further purchases. Meanwhile, official media reported that securities regulators will meet with market participants to discuss measures to support the stable development of the capital market.
Regarding monetary policy, despite weaker-than-expected second-quarter GDP data indicating an uneven recovery, the People's Bank of China (PBOC) maintained its main lending rates at historically low levels for the 14th consecutive month in July. The one-year loan prime rate (LPR) remained at 3%, and the five-year LPR remained at 3.5%. Bank stocks led the gains, particularly Industrial and Commercial Bank of China (ICBC) (2.25%) and Agricultural Bank of China (ABC) (3.44%). In contrast, Shenghong Technology (-7.2%) and Huagong Tech (-10%) declined.
{Japan Monday Holiday; Market Closed}
Sector Performance:
Top Performing Sectors Today (Shanghai Composite Core Themes)
1. Power Utilities (Strongest Theme)
Leading gains, multiple stocks hit consecutive limit-up/limit-up: Huayin Power, Leshan Power (2 consecutive limit-up), Fuling Power, Jinkong Power, Hangzhou Thermal Power, Shanghai Power (limit-up)
Rationale: Record-high electricity load during summer heat, tight supply and demand for thermal power; undervalued sector, high dividends, attracting safe-haven funds
2. Coal Mining (Cyclical Weight)
Sector gain 5.47%, Dayou Energy, Zhengzhou Coal Power, Haohua Energy (limit-up)
Driven by: Significant decline in raw coal production, increased restocking demand from power plants, continued rise in thermal coal prices, strong certainty in half-year earnings reports
3. Oil & Gas Exploration/Oil Services
Sector surged 7%+, Zhongman Petroleum, CNOOC hit limit-up; international crude oil strengthened due to geopolitical support, highlighting the safe-haven attributes of resource-related stocks
4. Baijiu (Chinese liquor)/ Food & Beverage (Consumer Weighting)
The Shenwan Baijiu Index surged 5.3%, with Gujinggong hitting its second consecutive daily limit up in four days, and Kweichow Moutai rising 5.58%.
Catalysts: Official price increase by Feitian Moutai, expectations of consumption recovery, and institutional portfolio adjustments to undervalued consumer blue-chip stocks.
5. Banking, Insurance, and Pharmaceuticals (Supporting the Market)
ICBC, ABC, BOC, CCB, and CMB all rose over 2%; innovative drugs and traditional Chinese medicine saw a volatile recovery, representing a defensive allocation direction for funds.
Today's Leading Declining Sectors (Heaviest Hit Areas Throughout the Day)
1. PCB/Copper Clad Laminate (CCL): Leading the decline across the board, with Jinan Guoji, Tongguan Copper Foil, and Baoding Technology all hitting their daily limit down; previous large gains and crowded trading led to significant profit-taking and exits.
2. Optical Modules/CPO/Memory Chips: Computing power hardware saw a broad sell-off, with Yuanjie Technology hitting its 20% daily limit down; memory stocks have experienced consecutive days of sharp declines.
3. Semiconductor Electronic Specialty Gases and Lithography Machines: A collective pullback in the Sci-Tech Innovation Board dragged down the Sci-Tech 50 Index. Weakening
4. Extended Weakness: High-valuation growth sectors such as lithium batteries, photovoltaic equipment, and robotics all weakened.
Fund Flow: The electronics sector saw a net outflow of over 10.6 billion yuan in a single day, with technology hardware becoming the main outlet for selling pressure.
Technical Analysis:
The Shanghai Composite Index closed at 3,796.28 points, up 0.85%; the highest point of the day was 3,831.66, and the lowest was 3,741.11; the Shanghai Composite's turnover was 1.2947 trillion yuan, an increase of 48.3 billion yuan compared to last Friday. The market saw a high-volume, divergent, bottoming-out rebound with a long lower shadow bullish candlestick. Risk Warning: The following content is for technical review and analysis only and does not constitute any investment advice. The market exhibits extremely strong structural differentiation; although the index closed higher, over 3,700 individual stocks declined. Gains in the index do not translate to gains in individual stocks; short-term volatility risk is extremely high. The market opened higher, surged, and then retreated, closing above 3790 with a high-volume red doji. Strong resistance lies at 3840 (intraday high + short-term moving average resistance), while key support is at 3740 (today's low). Short-term moving averages: the 5/10-day moving averages are still turning downwards, indicating no bullish reversal. The current movement is merely a correction driven by heavyweight stocks, not a full-blown reversal. Today's volume was high, but the number of rising stocks was extremely small. The high volume suggests profit-taking in high-flying tech stocks and buying support in lower-priced cyclical stocks, indicating insufficient new capital inflows and questionable sustainability of the rebound. MACD technical indicators: the green bars are shortening, but a daily golden cross has not formed, suggesting weakening bearish momentum but no clear bullish turning point, only oversold correction. KDJ: after low-level consolidation, it has slightly turned upwards, indicating a short-term rebound demand, but it remains in a weak range, limiting its potential. The weekly chart shows three consecutive weeks of declines, and the weekly MACD, a death cross has formed, confirming a mid-term correction cycle. The short-term rebound is merely a bottoming-out process; a reversal requires a significant increase in volume and a firm hold above 3,860, along with sustained inflows of new funds.
Trading Strategy:
This information is for market analysis and reference only and does not constitute any trading or investment advice.
Operating Approach:
Long Entry Conditions (Buy on Dips, Avoid Chasing Rallies)
• A pullback to the 3740-3750 range with decreasing volume and capital inflows indicates a potential opportunity to buy high-dividend stocks, undervalued consumer leaders, and pharmaceutical companies with positive interim earnings forecasts.
• Entry Prerequisites: Total trading volume in both Shanghai and Shenzhen stock exchanges is no less than 2.6 trillion yuan; northbound capital flows are consistently net inflows; the AI sector no longer experiences widespread limit-down days; and the market's loss-making effect is diminishing.
Short Selling/Hedging Strategy (Avoid High-Flying Sectors if Short Selling Tools Are Unavailable)
Investors without stock index futures trading privileges: Directly avoid high-flying sectors such as computing power, optical communication, and PCB, which have experienced significant declines.
Investors holding CSI 300/SSE 50 options or stock index futures: Consider shorting at the 3830 resistance level to hedge against potential pullbacks.
Risk Warnings:
Market divergence is extreme; a rise in heavyweight stocks does not guarantee a broad-based rally. Blindly buying small-cap stocks is highly likely to result in sustained losses.
Short-term selling pressure in the technology sector has not been fully released, and the rebound from oversold conditions is weak. Buying on dips has a very low margin for error.
The 3840-point level presents significant short-term resistance. If trading volume cannot sustain its upward momentum, there is a high risk of a pullback after a surge.
During the interim earnings season, some high-flying growth stocks face the risk of falling below expectations.
Disclaimer: The information contained herein (1) is proprietary to BCR and/or its content providers; (2) may not be copied or distributed; (3) is not warranted to be accurate, complete or timely; and, (4) does not constitute advice or a recommendation by BCR or its content providers in respect of the investment in financial instruments. Neither BCR or its content providers are responsible for any damages or losses arising from any use of this information. Past performance is no guarantee of future results.
More Coverage




Risk Disclosure:Derivatives are traded over-the-counter on margin, which means they carry a high level of risk and there is a possibility you could lose all of your investment. These products are not suitable for all investors. Please ensure you fully understand the risks and carefully consider your financial situation and trading experience before trading. Seek independent financial advice if necessary before opening an account with BCR.
BCR Co Pty Ltd (Company No. 1975046) is a company incorporated under the laws of the British Virgin Islands, with its registered office at Trident Chambers, Wickham’s Cay 1, Road Town, Tortola, British Virgin Islands, and is licensed and regulated by the British Virgin Islands Financial Services Commission under License No. SIBA/L/19/1122.
Open Bridge Limited (Company No. 16701394) is a company incorporated under the Companies Act 2006 and registered in England and Wales, with its registered address at Kemp House, 160 City Road, London, England, EC1V 2NX. Open Bridge Limited acts solely as a payment processor for BCR Co Pty Ltd and does not provide any financial, trading, or investment services on its behalf. Open Bridge Limited's role is limited to payment processing.


 English
 简体中文
简体中文
 繁體中文
繁體中文
 Bahasa
Melayu
Bahasa
Melayu
 Tiếng
Việt
Tiếng
Việt
 ไทย
ไทย
 日本語
日本語
 한국어
한국어
 ភាសាខ្មែរ
 español