


0
US Dollar Index
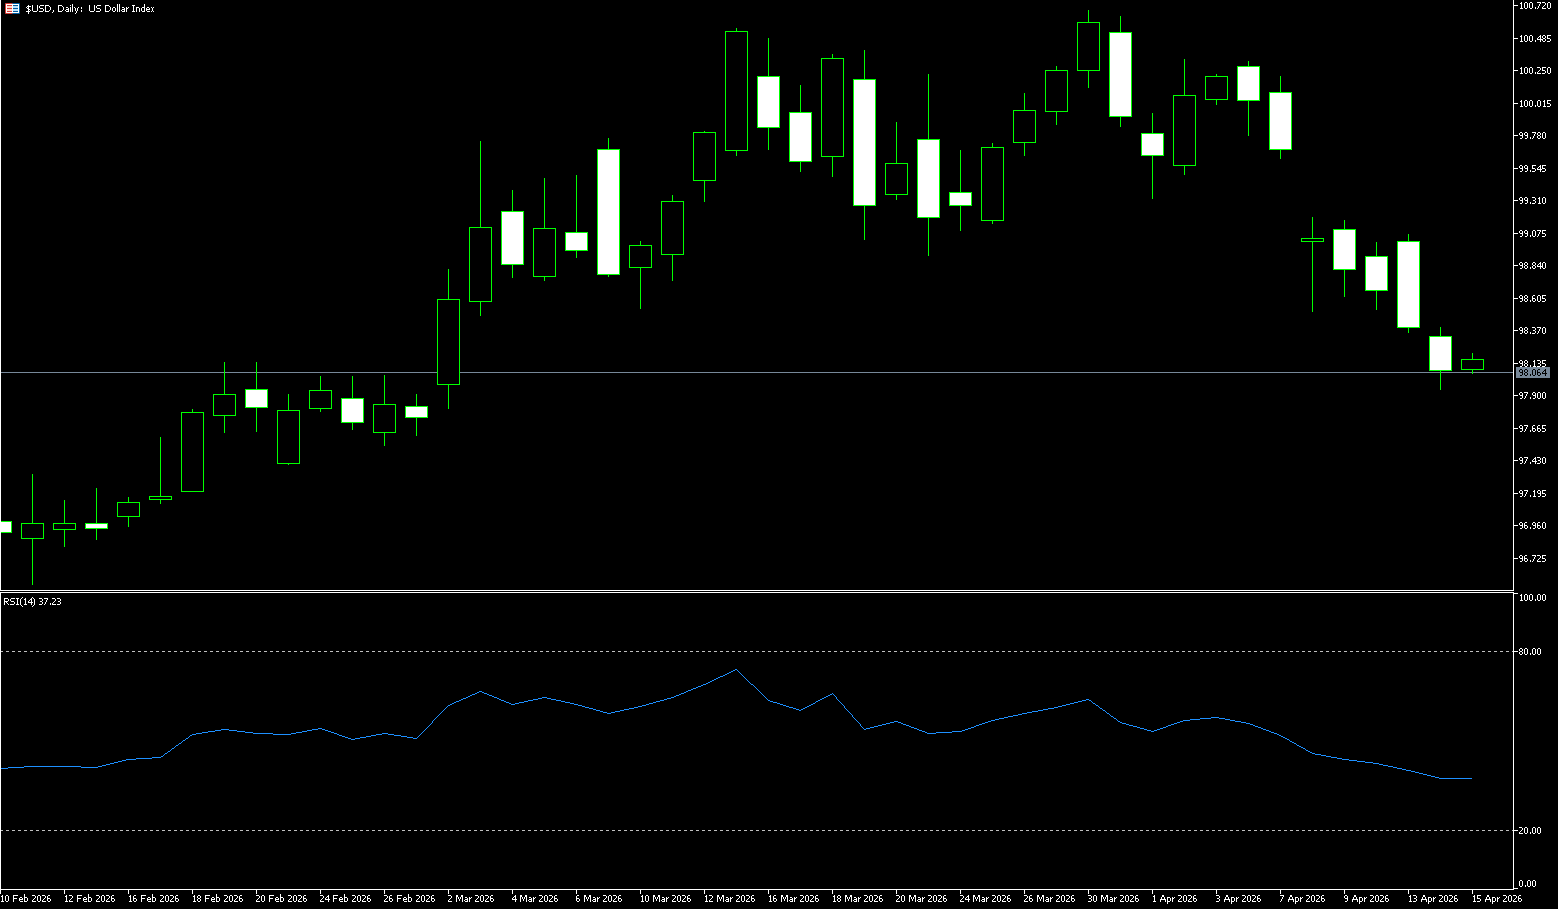
The US dollar index hovered around 98 on Wednesday, near a six-week low, as investors became more optimistic about diplomatic progress between the US and Iran, while oil prices remained below recent highs. Financial markets have largely eliminated risk premiums since the conflict began in late February, as both sides move toward a second round of negotiations. President Donald Trump stated that the war is "very close to ending," adding that Iran appears open to a peace agreement and negotiations are expected to resume soon. Regarding monetary policy, the market widely expects the Federal Reserve to keep interest rates unchanged this month, possibly until the end of the year, while Chicago Fed President Austan Goolsby warned that any rate cuts could be delayed until 2027 if high energy prices persist.
Market optimism regarding the resumption of US-Iran peace talks has increased. Trump's statements and news that negotiations may take place this week have weakened the dollar's safe-haven appeal; meanwhile, falling oil prices have further reduced energy risk premiums, leading to a sell-off in the dollar. Overall, the market tends to believe that the positive factors have been partially priced in, and without a significant escalation, the dollar is unlikely to receive strong support. The US dollar index broke significantly below its 200-day moving average of 98.53 on Tuesday, indicating a shift to a neutral or slightly bearish short-term trend. The 200-day moving average may provide dynamic support/resistance; watch for breakout signals above or below this level. Currently, the dollar index has broken below its 50-day, 100-day, and 200-day moving averages, indicating weakening medium- to long-term momentum. Short-term moving averages are showing a death cross or a flattening trend. Support is seen in the 98.00-98.10 area, while resistance is around 98.53 (200-day moving average) and 98.71 (50-day moving average). A break below 98.00 could test the March 2nd low of 97.77 and the February 23rd low.
Today, consider shorting the US Dollar Index at 98.15, with a stop-loss at 98.25 and targets at 97.70 and 97.60.
WTI Crude Oil
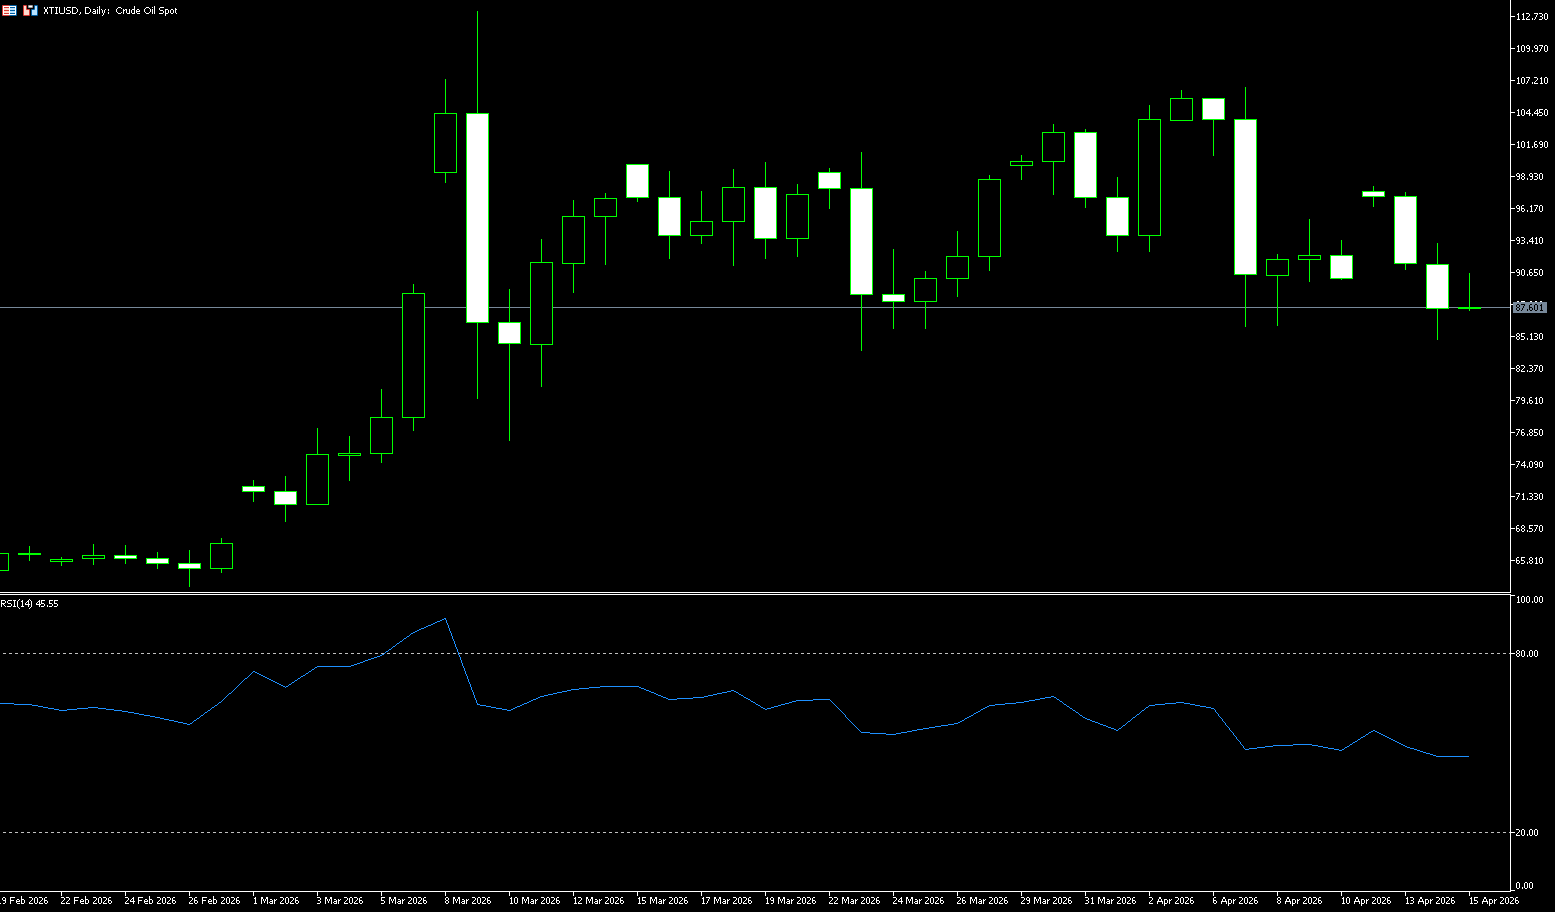
Trump indicated that negotiations aimed at ending the war with Iran might resume in Pakistan within the next two days. Affected by this, US crude oil is currently trading around $89.70 per barrel, and may test the $87 per barrel level during the day. The International Energy Agency (IEA) monthly report points out that attacks on Middle Eastern energy facilities and Iran's de facto blockade of the Strait of Hormuz have caused the most severe oil supply disruption in history, reducing supply by 10.1 million barrels per day in March. Restoring oil transport through the Strait remains the most critical factor in alleviating energy supply and oil price pressures. The US military has extended its blockade to the Gulf of Oman and the Arabian Sea, allowing passage to three Iranian-linked oil tankers whose destinations are not Iranian ports. Meanwhile, five sources indicate that US-Iran negotiating teams may return to Islamabad this week, and the Pakistani Prime Minister confirmed that efforts are ongoing. The IEA has also significantly lowered its global oil supply and demand forecasts, reducing its 2026 demand growth forecast by 80,000 barrels per day and its supply forecast by 1.5 million barrels per day.
Trading in the crude oil market remains primarily driven by marginal improvements in navigation through the Strait of Hormuz and the progress of US-Iran negotiations. Currently, there are few marginal changes in the market, but the negotiation progress has seen new developments. Overall, the US strategy of using blockade to promote peace talks has kept Middle East geopolitical risks within a "controlled pressure" range, and the crude oil market does not need to over-price extreme supply risks. In the short term, oil prices are more likely to fluctuate within the current range, and trading should focus on the timing of US-Iran negotiations and breakthroughs in key issues (Strait navigation + uranium enrichment). Technically, WTI crude oil broke below the upward trend line but found support near the 40-day moving average (around $86.19) and Wednesday's low (around $84.86). Current resistance levels are the 5-day moving average (around $90.44) and Tuesday's high of $93.16.
Consider going long on crude oil today at $87.60, with a stop-loss at $87.45 and targets at $89.00 and $90.00.
Spot Gold
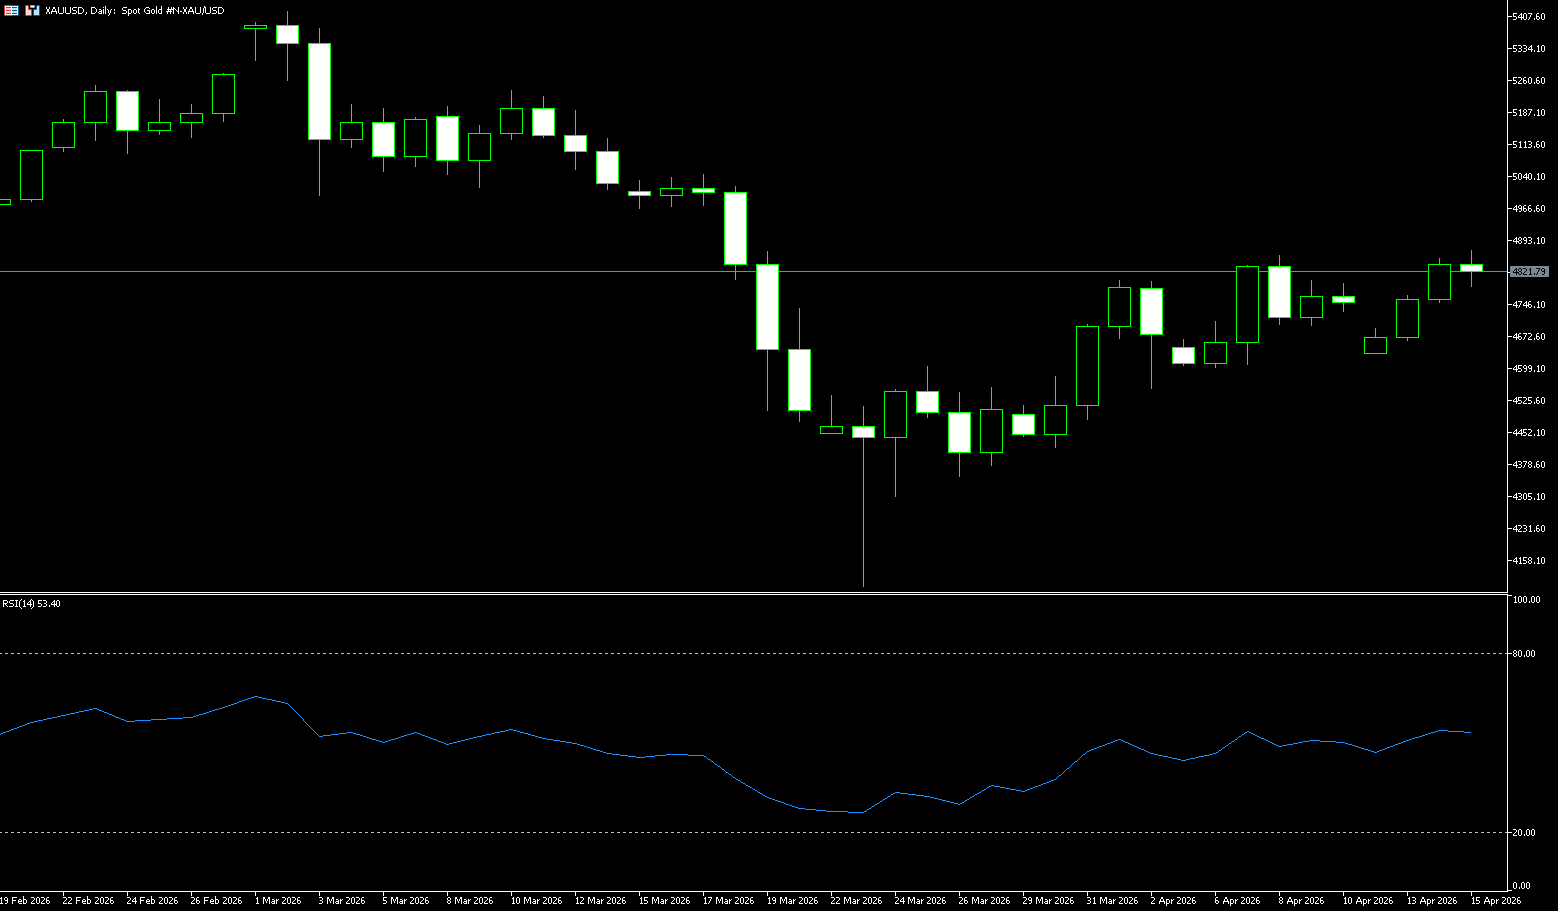
The gold market saw a significant rebound. Spot gold rose as much as 1.5%, touching $4,850 during the session. Fundamental data further supported gold. The US March Producer Price Index (PPI) rose 0.5% month-on-month, lower than the market expectation of 1.2%; year-on-year, it rose 4.0%, also lower than the expected 4.6%. Although energy prices remain high due to the war, service costs have remained stable, and overall inflationary pressures have not spiraled out of control as the market's most pessimistic expectations suggested. Chicago Fed President John Goolsby said on Tuesday that inflation expectations are generally stable, but also warned that the room for interest rate cuts in 2026 will narrow if inflation does not cool significantly. Traders have now priced in a Fed rate cut this year at around 28%, and the high-interest-rate environment continues to put some pressure on gold, which has no yield. However, as long as the market does not begin to seriously discuss a Fed rate hike (there are currently no signs of this), gold prices are unlikely to fall further. The direction of the gold market will depend on the progress of the Pakistan negotiations and what results can be achieved before the weekend. If positive news emerges, metal prices will continue to rise. Currently, a weaker dollar and lower oil prices are doubly beneficial for gold, as the extreme sentiment of rushing to exchange for cash and concerns about energy supplies at the beginning of the war has eased.
This round of gold price rebound is the result of a triple resonance of "declining safe-haven demand + a weaker dollar + a temporary easing of inflation concerns." Technically, gold remains in a clear range-bound pattern. Spot gold is currently firmly sandwiched between the 50-day moving average (approximately $4902) and the 100-day moving average (approximately $4702). The Relative Strength Index (RSI) is at a neutral level around 54, while the Average Directional Index (ADX) is close to 11, indicating that trend strength is weakening rather than strengthening. In the short term, gold's upward momentum remains cautious, and without a breakout catalyst, prices are likely to continue fluctuating within the narrow range of the past two weeks. Only if gold prices effectively close above and hold above the 50-day moving average of $4,902 can the current downtrend truly reverse towards the $5,000 psychological level; conversely, if the $4,765 (89-day moving average) support is breached, the decline could intensify again towards the $4,700 (psychological level) and $4,702 (100-day moving average) area.
Today, consider going long on spot gold at 4,792, with a stop loss at 4,788 and targets at 4,850 and 4,860.
AUD/USD
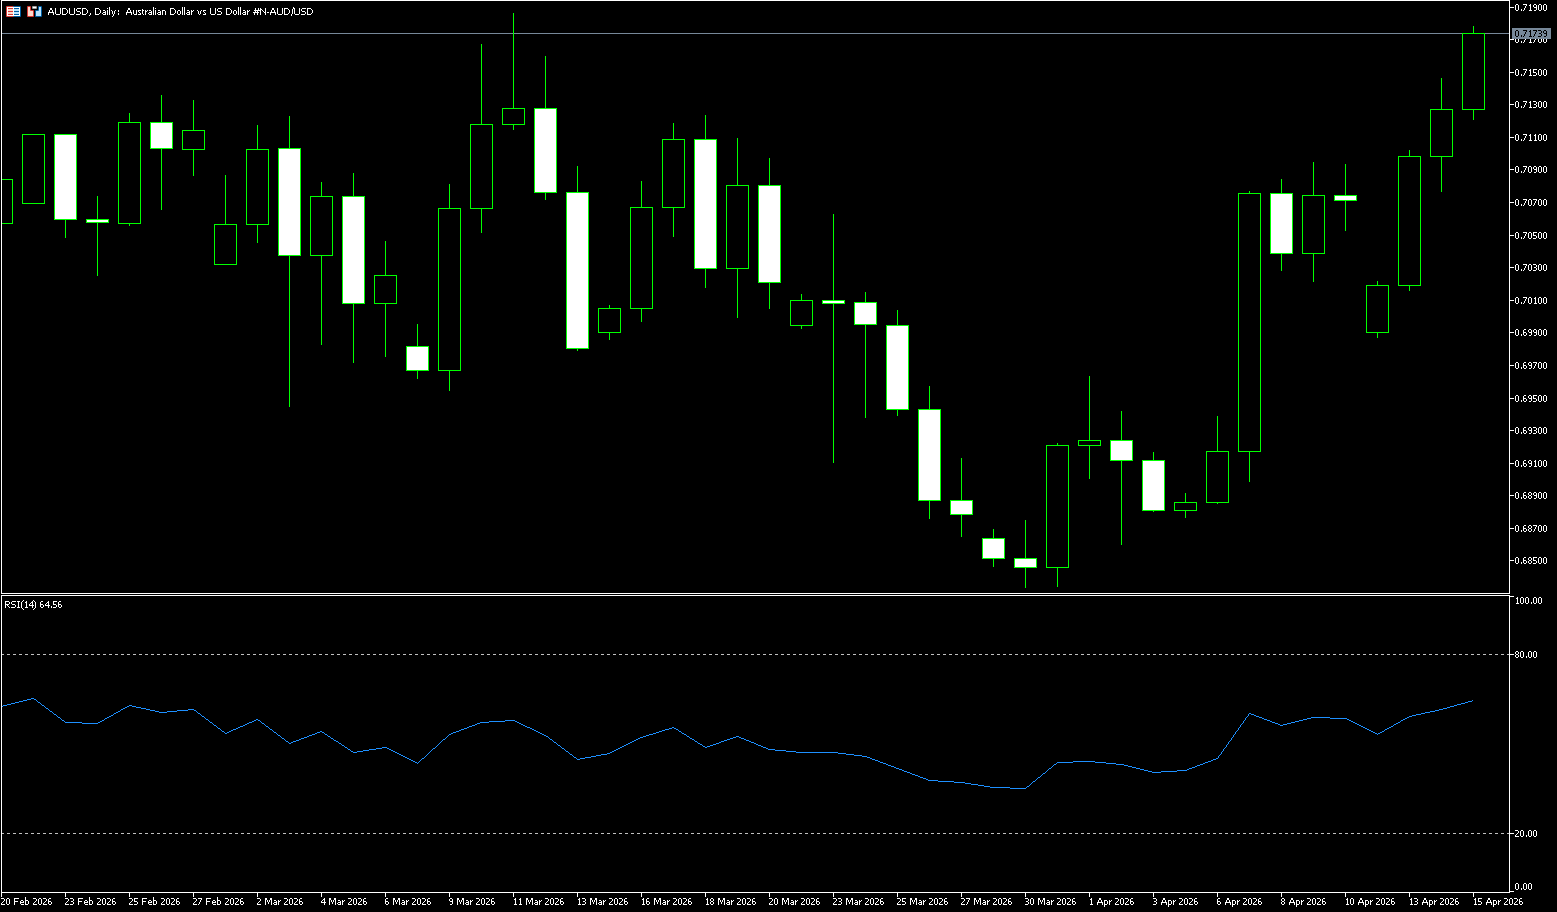
The AUD/USD pair reached around 0.7180, its highest level in five weeks, as market hopes for a US-Iran peace deal rose, while investors weighed the latest comments from the Reserve Bank of Australia. Deputy Governor Andrew Hauser emphasized that inflation remains above the 2-3% target, and policymakers lack strong confidence that current interest rates are sufficient to restrain inflation. He noted that interest rates may need to rise further if necessary, especially as the economy absorbs the inflationary effects of high oil prices linked to the Middle East turmoil. Following Hauser's comments, the market slightly increased the probability of a rate hike next month from 69% to 72%. First-quarter inflation data, key labor market indicators, and consumer spending indicators will still be released this month as a basis for decision-making. Meanwhile, the US and Iran have indicated their willingness to extend negotiations to achieve a lasting ceasefire. This comes after President Trump announced a blockade of Iranian oil shipments following a long weekend of unsuccessful talks.
On the daily chart, the Australian dollar is trading at 0.7180 against the US dollar, maintaining a constructive bullish bias as the spot price holds above the 55, 100, and 200-day simple moving averages, which are roughly clustered between 0.67 and 0.70. Momentum supports the upside, with the 14-day Relative Strength Index (RSI) hovering around 65, suggesting continued buying pressure, while the lower 14-day Oriented Index (ADX) indicates that the rally is solid but has not yet entered a strong trend phase. On the upside, short-term resistance lies at the psychological level of 0.7200, a convergence of Fibonacci projections and previous horizontal resistance, followed by resistance at 0.7283. Initial support is located near the psychological level of 0.7100, followed by the 9-day simple moving average around 0.7036.
Consider going long on the Australian dollar at 0.7163 today, with a stop loss at 0.7150 and targets at 0.7230 and 0.7250.
GBP/USD
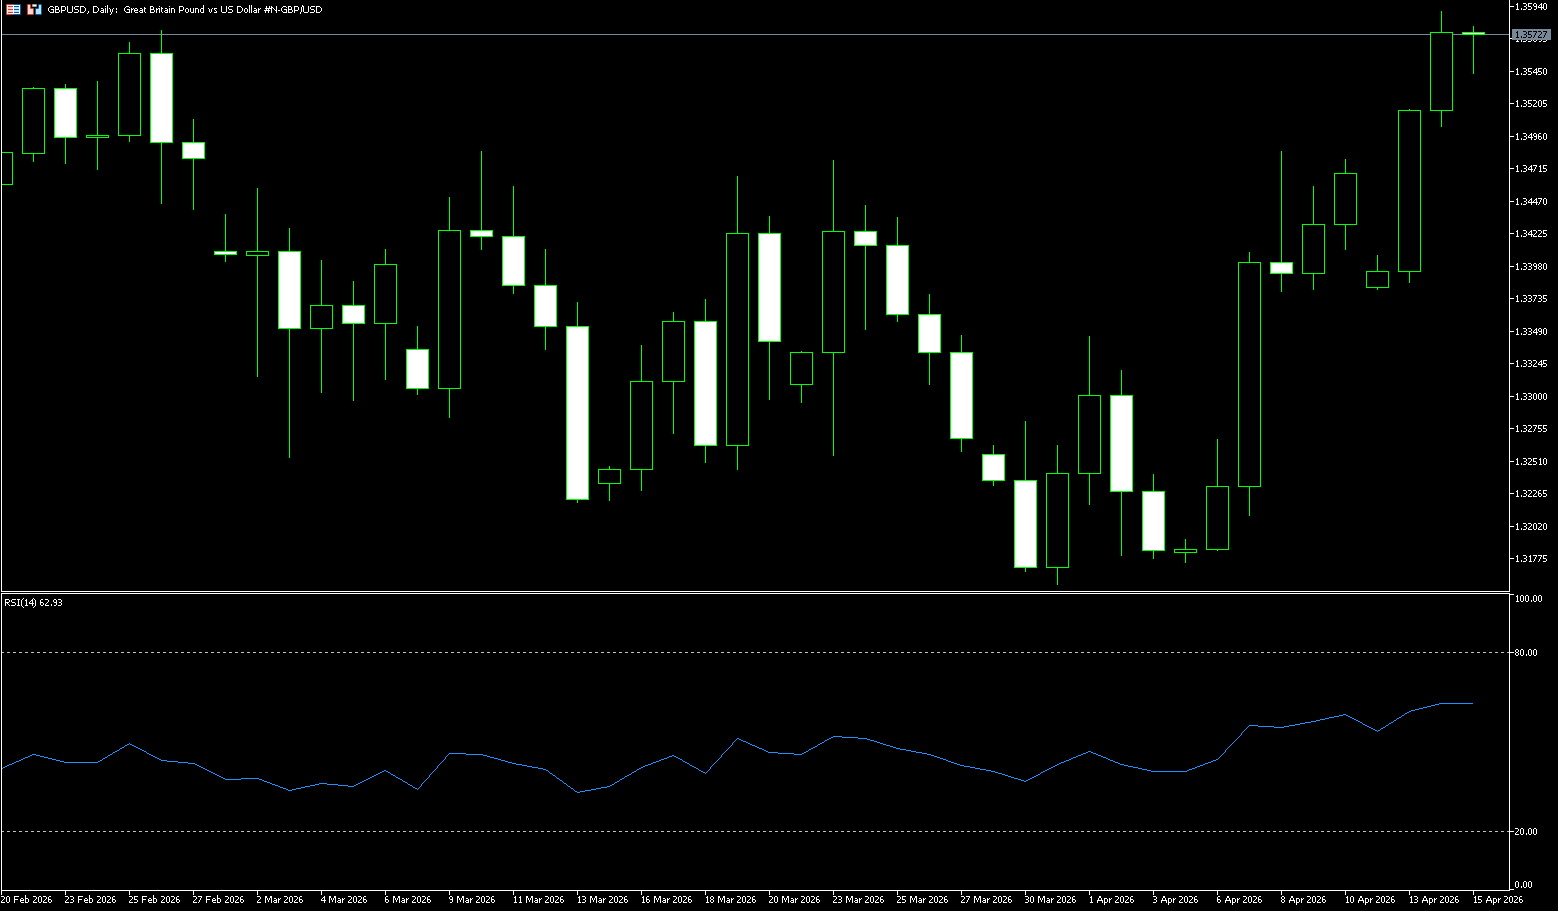
The pound/dollar pair rose to $1.36, its highest level since mid-February, as investors braced for potential Middle East peace talks despite the ongoing US blockade of Iranian ports. Risk sentiment improved as US and Iranian delegations were expected to resume talks this week in Islamabad, following a failed round of negotiations, and oil prices fell below $100 a barrel. However, with inflationary pressures from high energy costs persisting and the Strait of Hormuz remaining closed, the market anticipates a more hawkish stance from the Bank of England. Traders now expect nearly two rate hikes by the end of the year. Domestically, UK same-store retail sales rose 3.1% in March, with food sales increasing by 6.2%, as consumers stocked up for the Easter holidays.
The pound maintained its upward momentum at the close of trading this week, hovering near a two-month high of around 1.3570. Meanwhile, the pound's strong rise was driven by a sell-off in the dollar amid improved sentiment over hopes for a more lasting ceasefire between the US and Iran. On the daily chart, the pound approached the psychological level of 1.3600 overnight, and the recent break above the 5-day simple moving average (1.3506) on the 4-hour chart is favorable for GBP/USD bulls. Furthermore, a positive MACD reading indicates solid upward momentum. However, the Relative Strength Index (RSI) is near 62, suggesting it's approaching overbought territory, which could slow the rally rather than lead to an immediate reversal. On the upside, initial resistance lies at the psychological level of 1.3600. Next is 1.3671 (the high of February 12th). Immediate support is seen at the 50% Fibonacci retracement level of 1.3512 and the 1.3500 area. Then comes the 1.3458 level (the high of April 9th).
Today, consider going long on GBP at 1.3550, with a stop-loss at 1.3540 and targets at 1.3600 and 1.3620.
USD/JPY
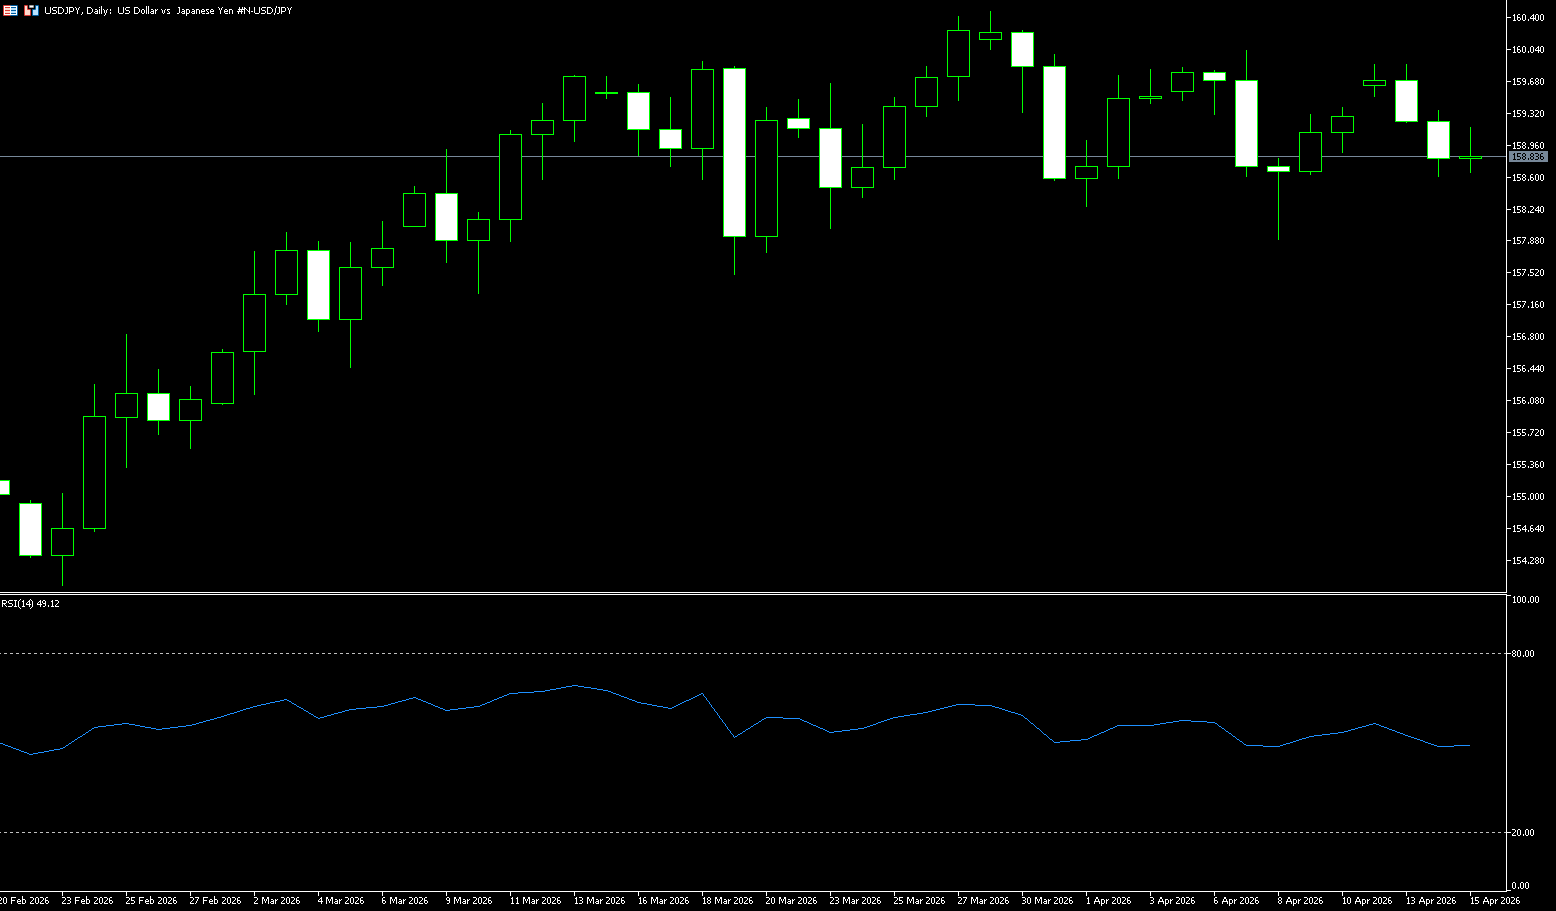
The USD/JPY pair consolidated its losses from the previous day during Wednesday's Asian session, trading within a narrow range below the 159.00 level. However, spot prices remain confined to a broader trading range over the past month or so, and aggressive directional bets should proceed with caution amid mixed signals. Despite optimism regarding Iranian diplomacy, the yen has struggled to attract meaningful buying due to economic concerns stemming from instability in the Strait of Hormuz. The US Navy's blockade of Iranian ports took effect on Monday, threatening further restrictions on already closed oil flows through this vital waterway. Given Japan's heavy reliance on Middle Eastern oil imports, this blockade exacerbates concerns about significant economic pressure for the foreseeable future. This, in turn, weakens the yen and becomes a tailwind for the USD/JPY pair. Furthermore, intervention concerns may continue to provide some support for the yen and limit upside potential for the USD/JPY pair.
On the daily chart, USD/JPY is trading around 159, maintaining a short-term bullish bias. The current price is holding above the 50-day and 200-day simple moving averages, located at 157.54 and 153.43 respectively. These two simple moving averages show a short-term trend above the long-term trend, indicating that the overall uptrend remains intact, although the Stochastic Relative Strength Index (RSI) has slipped to a low of around 28, suggesting weakening upward momentum and a possible pause in the trend. Initial support is located at 158.31, near the 40-day simple moving average. A break below this level would expose stronger support at the April 8 low of 157.89. As long as the price remains above these moving averages, pullbacks can be viewed as corrections within the uptrend; a daily close above the 159 (psychological level) and the area around 159.06 (Wednesday's high) would indicate increased upward pressure and a potential deeper rise.
Today, consider shorting the US dollar at 159.10, with a stop loss at 159.30 and targets at 158.20 and 158.30.
EUR/USD
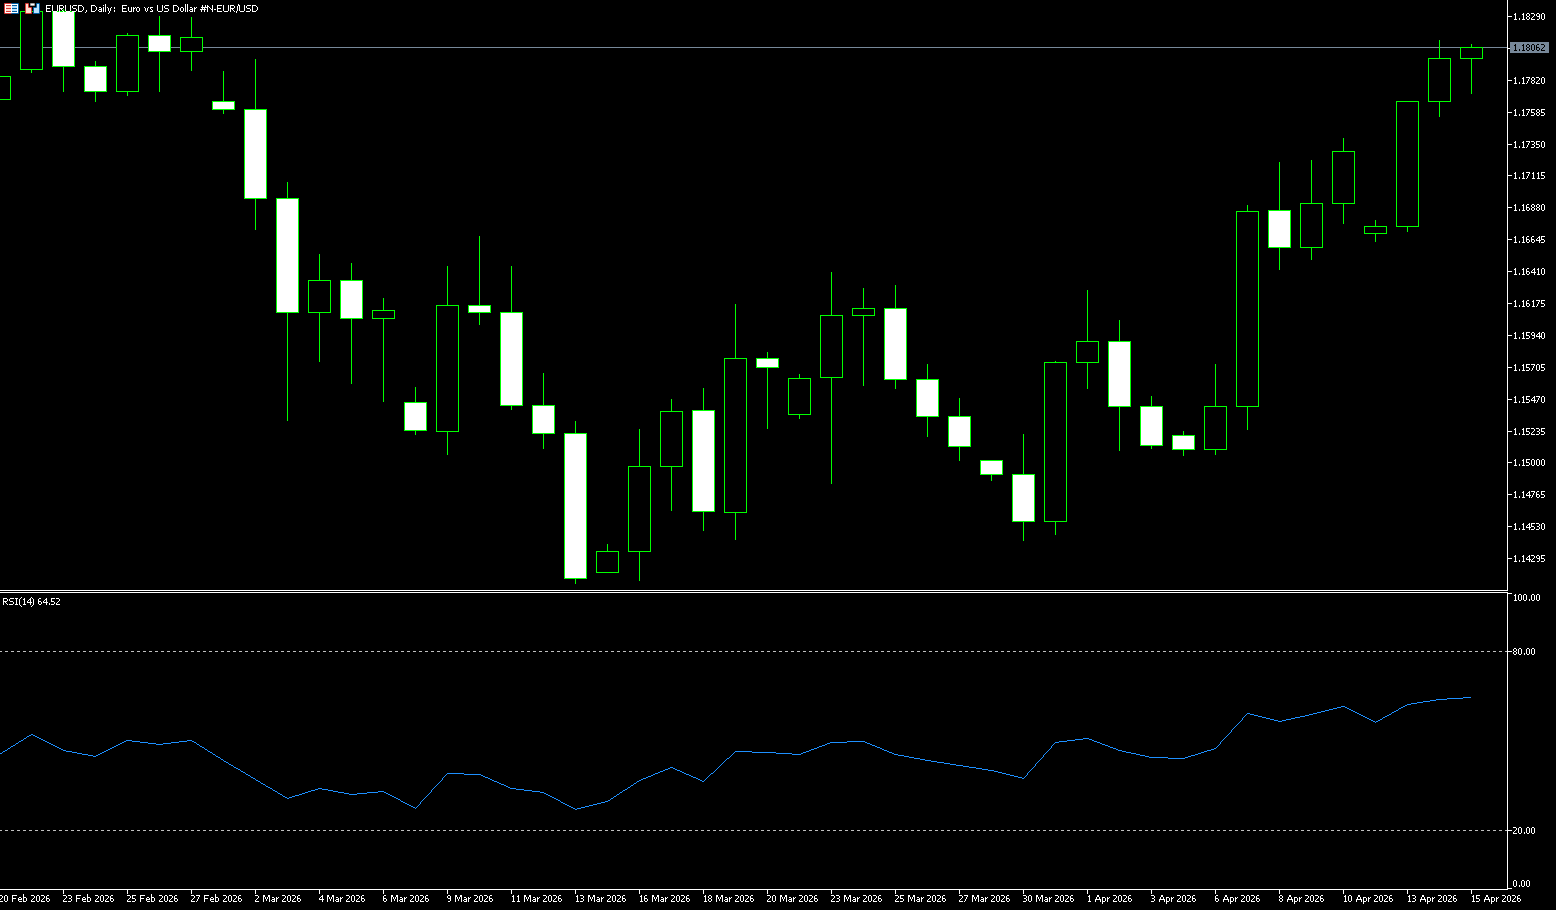
The EUR/USD pair consolidated after seven consecutive days of gains, trading around 1.1800 during Wednesday's American session. The pair may extend its gains as the US weakens on rising optimism that US-Iran negotiations could resume soon, with the market hoping for an agreement to end the conflict and reopen the Strait of Hormuz. US President Donald Trump indicated that negotiations could resume this week, while noting his opposition to a 20-year moratorium on Iran's nuclear enrichment program. Meanwhile, Vice President Vance emphasized "significant progress" in the initial round of Pakistan-Iran negotiations, with subsequent talks potentially scheduled within days. At the same time, weaker-than-expected US producer price index data reinforced the view that inflationary pressures are easing. The euro received support as energy prices eased pressure on the eurozone, which benefits as a net importer of crude oil and natural gas. The market expects the European Central Bank to moderately tighten policy at its April 30 meeting and raise interest rates twice more this year.
From a technical perspective, the four-hour chart shows the EUR/USD pair in a short-term bullish trend, as the price has clearly stabilized above its key moving averages. The 20-period simple moving average (SMMA) at 1.1738 provides the first layer of dynamic support, while the 50-period SMMA clusters around 1.1654, at a lower level, suggesting a solid upward trend on the basis. Momentum indicators remain constructive, rising within positive territory, while the 14-period Relative Strength Index (RSI) hovers around 67, indicating that buying pressure persists even as the pair climbs to new highs. Immediate resistance is located around 1.1830, the high reached at the end of February. A break above this level would target the psychological level of 1.1900. Initial support is seen at 1.1738 (the 20-period SMMA), and if the current rally pauses or retraces, buyers are expected to reappear in the 1.1700 area.
Consider going long on the Euro today at 1.1790, with a stop-loss at 1.1780 and targets at 1.1840 and 1.1850.
Disclaimer: The information contained herein (1) is proprietary to BCR and/or its content providers; (2) may not be copied or distributed; (3) is not warranted to be accurate, complete or timely; and, (4) does not constitute advice or a recommendation by BCR or its content providers in respect of the investment in financial instruments. Neither BCR or its content providers are responsible for any damages or losses arising from any use of this information. Past performance is no guarantee of future results.
More Coverage


Risk Disclosure:Derivatives are traded over-the-counter on margin, which means they carry a high level of risk and there is a possibility you could lose all of your investment. These products are not suitable for all investors. Please ensure you fully understand the risks and carefully consider your financial situation and trading experience before trading. Seek independent financial advice if necessary before opening an account with BCR.
BCR Co Pty Ltd (Company No. 1975046) is a company incorporated under the laws of the British Virgin Islands, with its registered office at Trident Chambers, Wickham’s Cay 1, Road Town, Tortola, British Virgin Islands, and is licensed and regulated by the British Virgin Islands Financial Services Commission under License No. SIBA/L/19/1122.
Open Bridge Limited (Company No. 16701394) is a company incorporated under the Companies Act 2006 and registered in England and Wales, with its registered address at Kemp House, 160 City Road, London, City Road, London, England, EC1V 2NX. This entity acts solely as a payment processor and does not provide any trading or investment services.

 English
 简体中文
简体中文
 繁體中文
繁體中文
 Bahasa
Melayu
Bahasa
Melayu
 Tiếng
Việt
Tiếng
Việt
 ไทย
ไทย
 日本語
日本語
 한국어
한국어
 ភាសាខ្មែរ
 español

